Normalize longitudinal IVIS images
Apply one shared radiance minimum, maximum, log or linear scale, colormap, and color bar across quantitative panels.
Free browser-based BLI workflow · Updated September 12, 2026
SimpleBLI turns supported IVIS acquisition folders into consistently scaled panels, ROI measurements, time-course plots, CSV data, and publication-ready figures. Nothing is installed.
The real app, on an anonymized real experiment
Import a longitudinal study, let the beta detector propose mouse outlines, review them, then use the same experiment to build shared-scale figures and signal plots. The screenshots below show the actual browser interface running an anonymized real experiment.
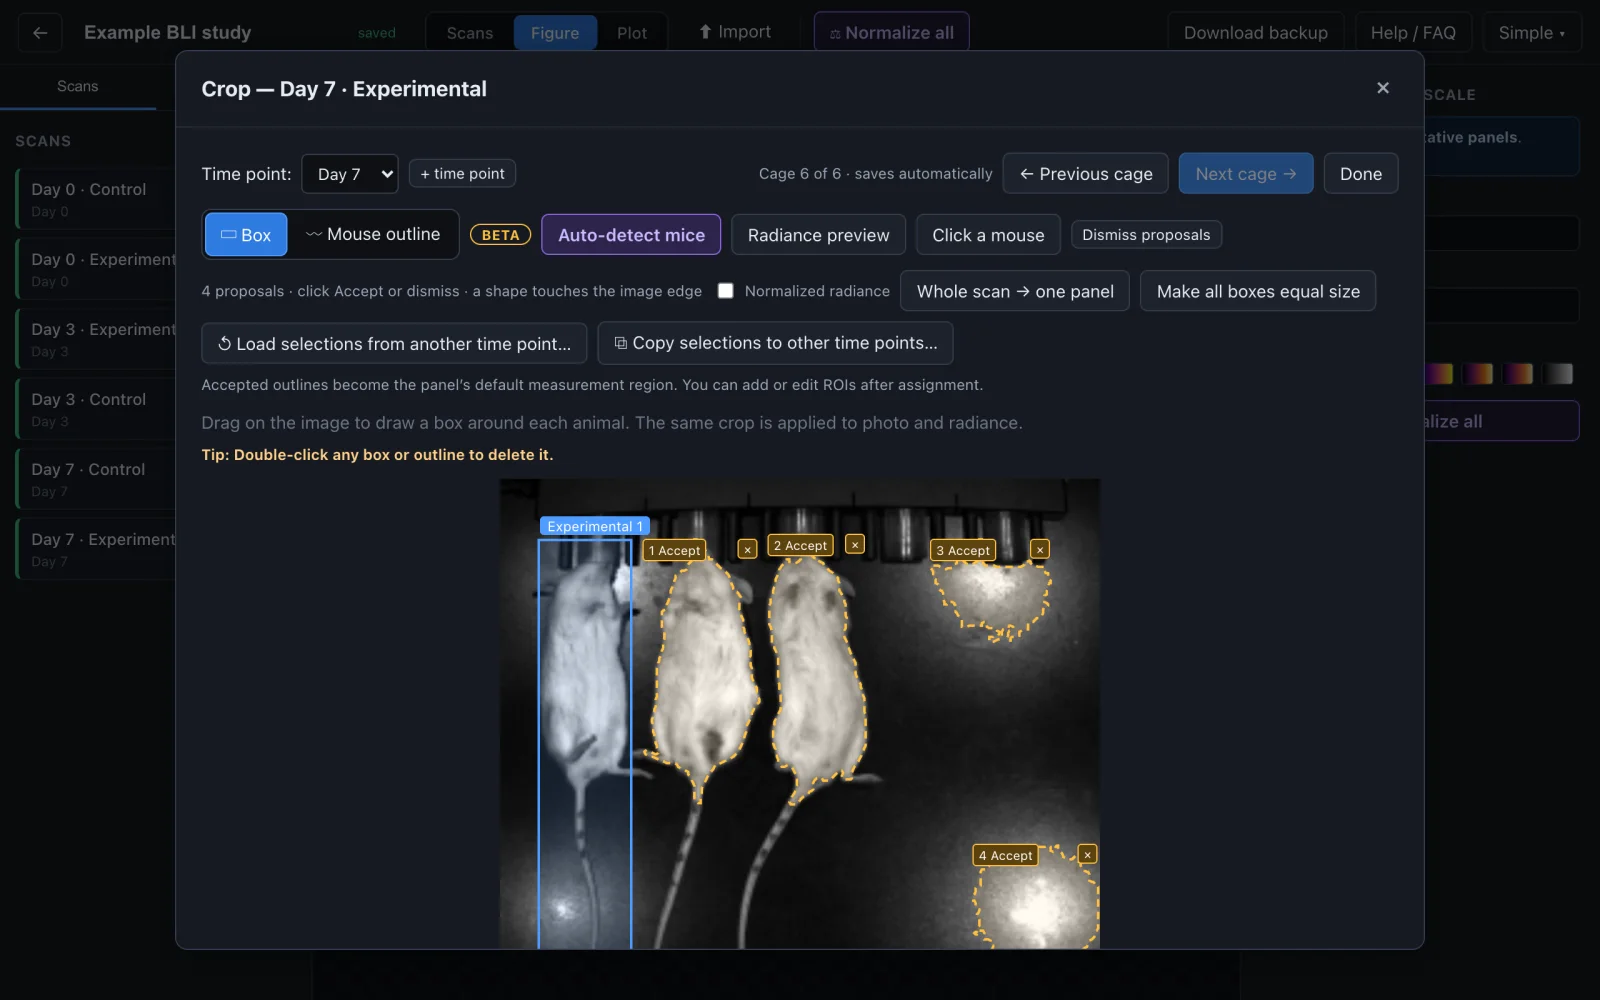
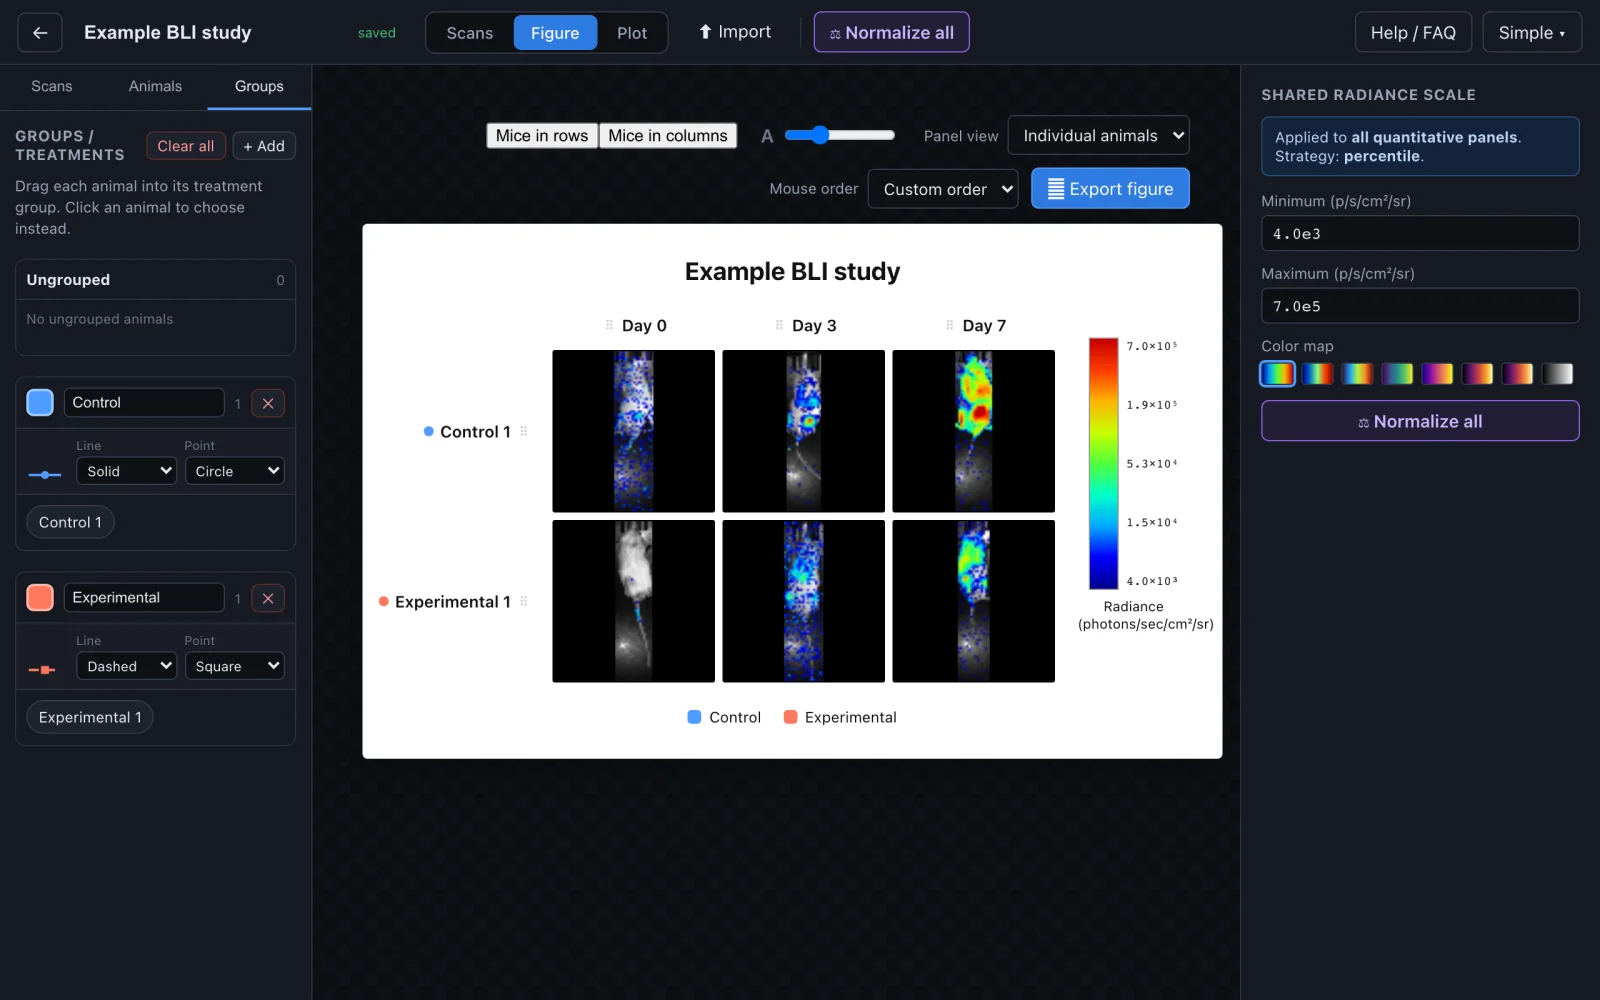
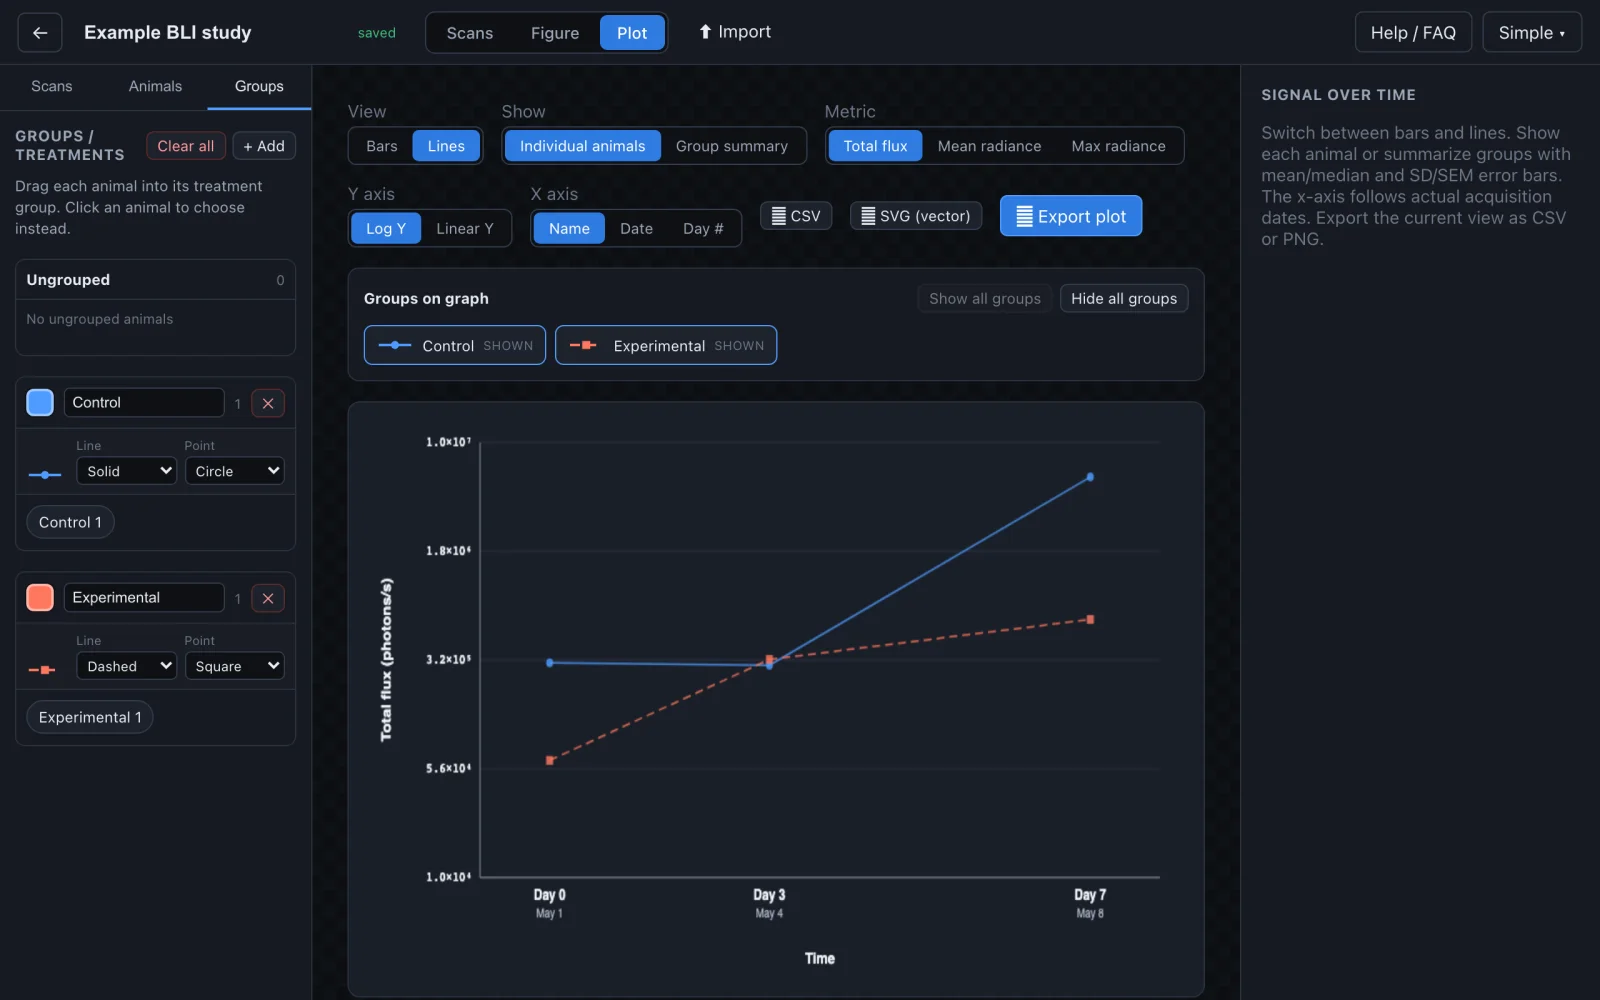
SimpleBLI covers the repetitive part of a BLI study: arranging animals across time points, keeping the display scale consistent, calculating comparable ROI summaries, and exporting one figure.
Apply one shared radiance minimum, maximum, log or linear scale, colormap, and color bar across quantitative panels.
Keep measurement ROIs separate from display annotations and export total-flux estimates, mean radiance, maximum radiance, and CSV data.
Compare animals, controls, and treatment groups using dated time points, group-colored traces, and mean or median summaries.
Arrange individual animals or whole scans, add labels and a shared color bar, and export the displayed figure as a 300 dpi PNG.
This workflow keeps quantitative measurements and figure assembly connected, and states explicitly which data is calibrated and which is rendered-only.
ClickInfo.txt and raw luminescent.TIF.Use the original acquisition folder whenever quantitative comparison matters. A screenshot or pseudocolor export may look correct but does not necessarily contain the calibration needed to recover radiance.
| Input | How SimpleBLI uses it | Quantitative? |
|---|---|---|
ClickInfo.txt + luminescent.TIF | Reads acquisition metadata, raw CCD counts, exposure, binning, read bias, field of view, f-number, and the matching calibration coefficient. | Yes, when the required metadata and coefficient are available. |
photograph.TIF | Uses the white-light photograph as the anatomical background under the luminescent signal. | Supports the overlay; radiance comes from the luminescent data. |
| Standalone TIFF, PNG, or JPEG | Imports the file as a rendered panel for layout and labeling. | No. Rendered-only images cannot be rescaled quantitatively. |
.amix or .aurax | Project files with these extensions are not opened. | No. Import the acquisition folder instead. |
ClickInfo.txt and raw luminescent.TIF) and preserves calibrated radiance..amix or .aurax project files.These measurements answer different questions. Record the metric, units, ROI method, and any background or normalization procedure in your analysis notes and figure legend.
Calibrated signal per unit area and solid angle. Radiance is used to map BLI intensity and set a common display scale across quantitative panels.
The mean radiance of pixels inside an ROI. It describes typical surface brightness but can change when the ROI boundary changes.
Signal integrated over the ROI, computed from radiance, ROI area, and a solid-angle term. Used for whole-signal comparisons.
Concise answers about free BLI software, supported files, ROI measurements, display normalization, privacy, and publication figures.
Yes. The analysis and export tools are free, and there is no installer or license key required. Paid plans increase active cloud experiment counts: Free keeps 2, Plus keeps 10, and Unlimited has no count limit. Each cloud backup is limited to 1 GB.
For supported 2D acquisition folders, yes. SimpleBLI reads ClickInfo.txt and luminescent.TIF directly. Keep the acquisition software for instrument control, project editing, 3D, CT, spectral unmixing, and other specialized workflows.
A supported acquisition needs ClickInfo.txt plus luminescent.TIF. photograph.TIF is optional but provides the white-light background. Quantitative status also depends on usable calibration metadata.
.amix or .aurax files?No. Project files with those extensions are not opened; import the acquisition folder instead. A rendered image export can be imported for layout only.
No. It covers a focused subset of work: supported 2D data import, shared display radiance scales, ROI summaries, plots, and figure assembly. It does not acquire images or perform advanced analysis.
Yes. Quantitative panels can share one minimum, maximum, logarithmic or linear mapping, colormap, and color bar. That prevents each image from using a visually misleading independent range.
Yes. Measurement ROIs report pixel count, area, mean, minimum, and maximum radiance, a documented total-flux estimate, and signal above an optional threshold. Measurements export as CSV.
ImageJ is useful for general image processing, but a rendered PNG or screenshot does not automatically preserve IVIS radiance calibration. Use original calibrated source data for quantitative work and validate any cross-software workflow.
Signed-out experiments stay in browser storage on the current device. Signing in adds private account-backed cloud backup. Review your institution’s data-handling requirements before using any web application.
Yes. SimpleBLI exports the displayed figure and plot as 300 dpi PNG files, with shared scales, color bars, labels, treatment colors, and individual-animal or whole-scan layouts.
No. SimpleBLI is limited to 2D bioluminescence workflows. Use the acquisition software for image acquisition, fluorescence calibration, tomography, spectral unmixing, multimodal registration, or CT analysis.
Use a metric that matches the biological question and keep the ROI method consistent. Total flux estimates whole-ROI signal; average radiance describes mean surface brightness; maximum radiance emphasizes the brightest pixel region.
Follow the tutorial with a worked two-group example, including crop autosave, group summaries, survival curves, and sharing.
Open SimpleBLI, create a free experiment, and drag in a supported IVIS acquisition folder. Your original files are not modified.
Open SimpleBLI free